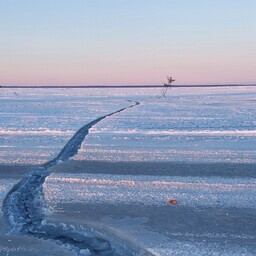
Läänemeres on jääkate väike.
Nüüd on jääkate 140 000 ruutkilomeetrit.
Varem oli see 180 000 ruutkilomeetrit.
TTÜ professor Rivo Uiboupin räägib sellest.
Väinameres on jää veel mõni päev.
Liivi ja Soome lahes liigub jää tuulte tõttu.
Uiboupin ütleb, et
jääd ei teki palju
.
jääd ei teki palju
Tõlge fraasile: jääd ei teki palju
EN
not much ice is forming
Talve tipp on möödas.
Läänemeres on
jää maksimum veebruari lõpus
.
jää maksimum veebruari lõpus
Tõlge fraasile: jää maksimum veebruari lõpus
EN
maximum ice at the end of February
Edela ja lõunakaare tuuled puhuvad.
Tuuled lõhuvad jääd.
Saaremaa-Hiiumaa lähedal on
avatud vesi
.
avatud vesi
Tõlge fraasile: avatud vesi
EN
open water
See on viie kilomeetri kaugusel.
Jääkattele võib koguneda vesi.
Edela tuuled ja veetase Eesti rannikul teevad seda.
Väinameres on veetase kõrge.
Satelliitpiltidel näidatakse Läänemere jääd.
See talv oli
jäärohkem kui keskmine
.
jäärohkem kui keskmine
Tõlge fraasile: jäärohkem kui keskmine
EN
more ice than average
2010/2011 talvel oli jääd rohkem.
See aasta oli üle keskmise.
Talv oli huvitav, sest
jää tekkis alles jaanuaris
.
jää tekkis alles jaanuaris
Tõlge fraasile: jää tekkis alles jaanuaris
EN
ice formed only in January
TTÜ näitab
jää kontsentratsiooni ja kiirust
.
jää kontsentratsiooni ja kiirust
Tõlge fraasile: jää kontsentratsiooni ja kiirust
EN
ice concentration and speed
Prognoos uueneb iga päev.
Mudeli täpsus on erinev.
Mudeli tegi TTÜ.
Projekt DTO4OWE on mudeli allikas.
The ice cover in the Baltic Sea is small.
Now the ice cover is 140,000 square kilometers.
Previously, it was 180,000 square kilometers.
TTÜ professor Rivo Uiboupin talks about this.
In Väinameri, the ice will last for a few more days.
In the Gulf of Liivi and the Gulf of Finland, the ice moves due to winds.
Uiboupin says that not much ice forms.
The peak of winter has passed.
The maximum ice in the Baltic Sea occurs at the end of February.
Southwest and south winds are blowing.
The winds break the ice.
Near Saaremaa-Hiiumaa, there is open water.
It is five kilometers away.
Water may accumulate on the ice cover.
The southwest winds and water level on the Estonian coast cause this.
The water level in Väinameri is high.
Satellite images show the ice in the Baltic Sea.
This winter had more ice than average.
The 2010/2011 winter had even more ice.
This year was above average.
The winter was interesting because ice formed only in January.
TTÜ shows the concentration and speed of the ice.
The forecast is updated daily.
The accuracy of the model varies.
The model was created by TTÜ.
The DTO4OWE project is the source of the model.